Source : https://www.csulb.edu/covid-19/dashboard
Vaccinations Administered on Campus to Students, Faculty, and Staff

This chart reflects the total number of COVID-19 vaccines administered on campus to faculty, staff, and students (15,235 as of the last update). This chart does not reflect shots received by members of the campus community at off-campus vaccination sites.
Current Active COVID-19 Cases
Faculty and Staff

This line graph illustrates the number of employees known to the university who on a specified date had an active unresolved case of the COVID-19 illness. The term “on-campus” is defined as individuals who had been on campus in the preceding 30 days at the time they tested positive (currently 0). The term “off campus” is defined as individuals who had not been on campus in the preceding 30 days at the time they tested positive (currently 0).
Students

This line graph illustrates the number of students known to the university who on a specified date had an active unresolved case of the COVID-19 illness. The term “on-campus” is defined as individuals who had been on campus in the preceding 30 days at the time they tested positive (currently 18). The term “off campus” is defined as individuals who had not been on campus in the preceding 30 days at the time they tested positive (currently 0).
Cumulative COVID-19 Cases
Faculty and Staff

This line graph illustrates the number of employees known to the university who at any time since the pandemic began had a confirmed case of the COVID-19 illness. The term “on-campus” is defined as individuals who had been on campus in the preceding 30 days at the time they tested positive (currently 160). The term “off campus” is defined as individuals who had not been on campus in the preceding 30 days at the time they tested positive (currently 49). Among this group, 1 COVID-related death has been reported.
Students

This line graph illustrates the number of students known to the university who at any time since the pandemic began had a confirmed case of the COVID-19 illness. The term “on-campus” is defined as individuals who had been on campus in the preceding 30 days at the time they tested positive (currently 246). The term “off campus” is defined as individuals who had not been on campus in the preceding 30 days at the time they tested positive (currently 354).
Fall 2021
On-Campus Student Housing
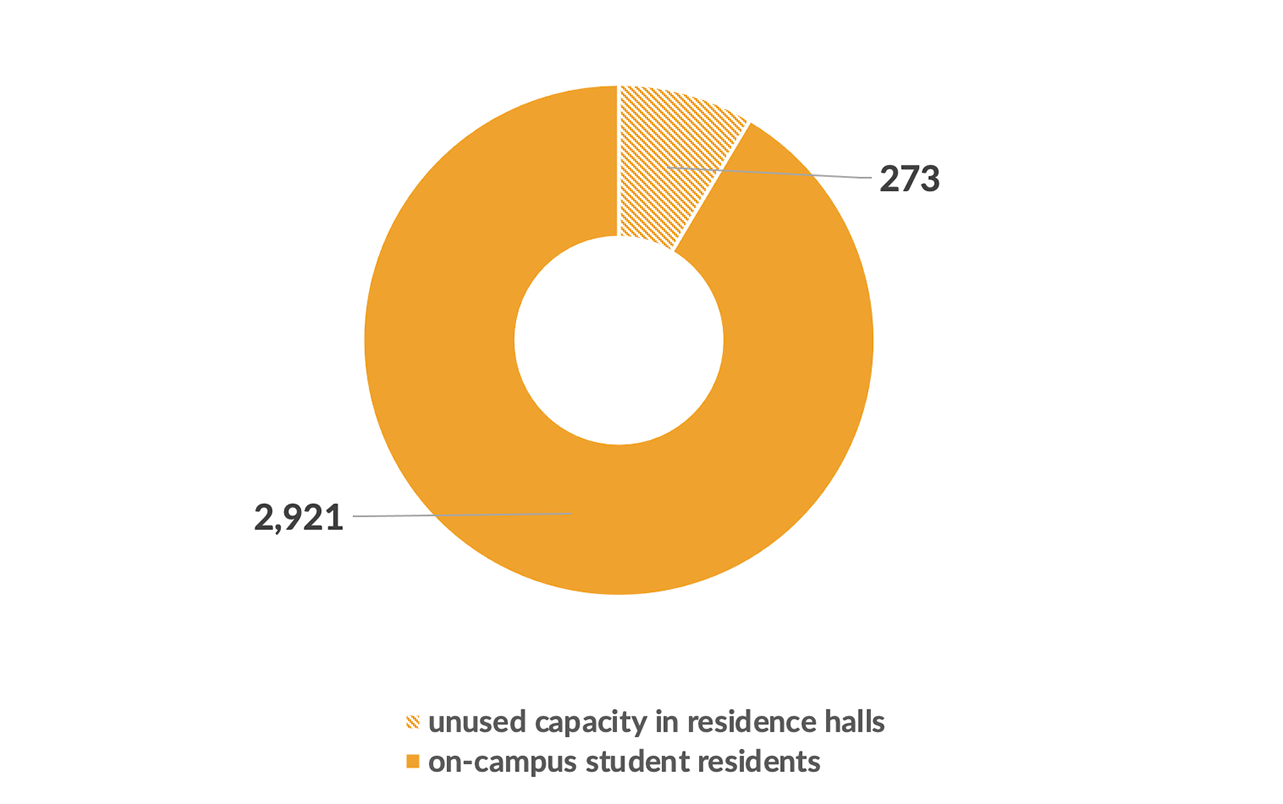
This pie chart illustrates the number of residents projected to be in on-campus student housing this fall (2921) and the number of unused beds (273), representing unused capacity.
Course Sections Offered
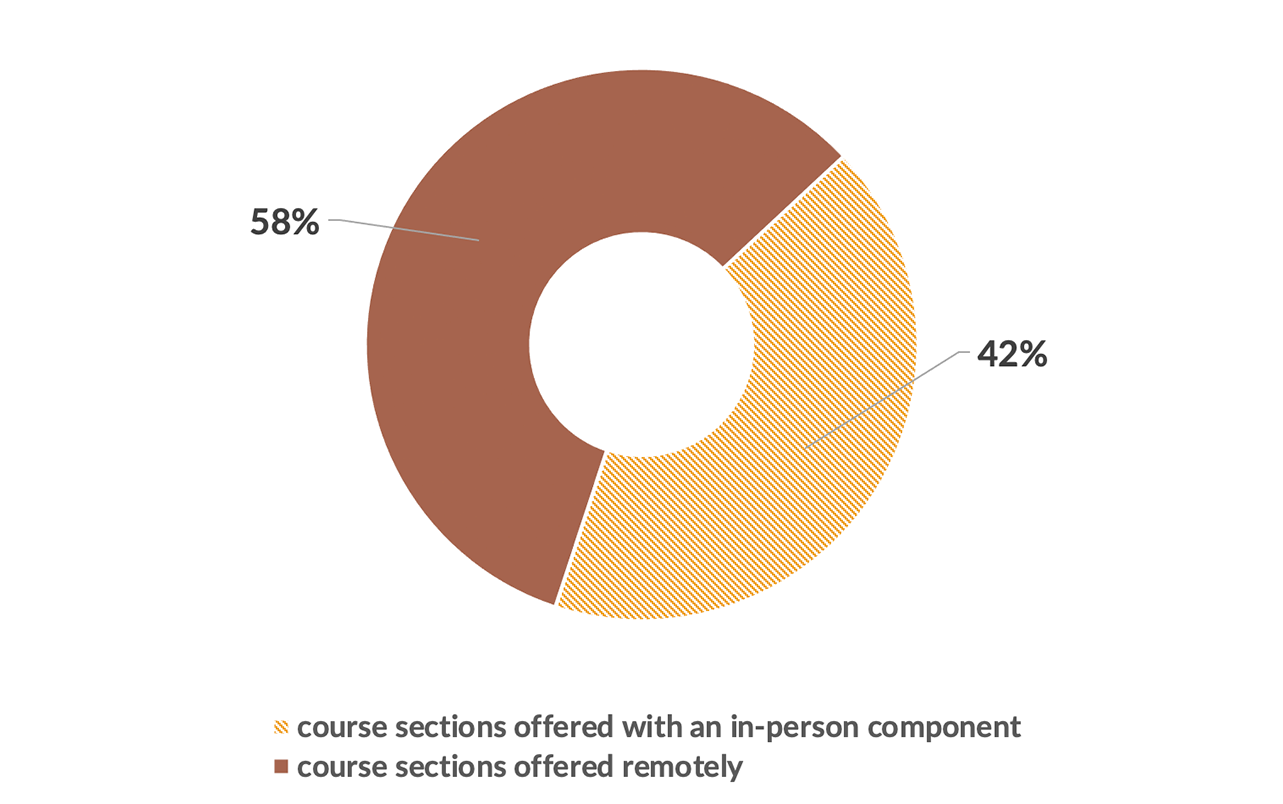
This pie chart illustrates the percentage of course sections this coming fall projected to have an in-person component (42%) and those that will be offered through remote instruction (58%).
Spring 2022
On-Campus Student Housing
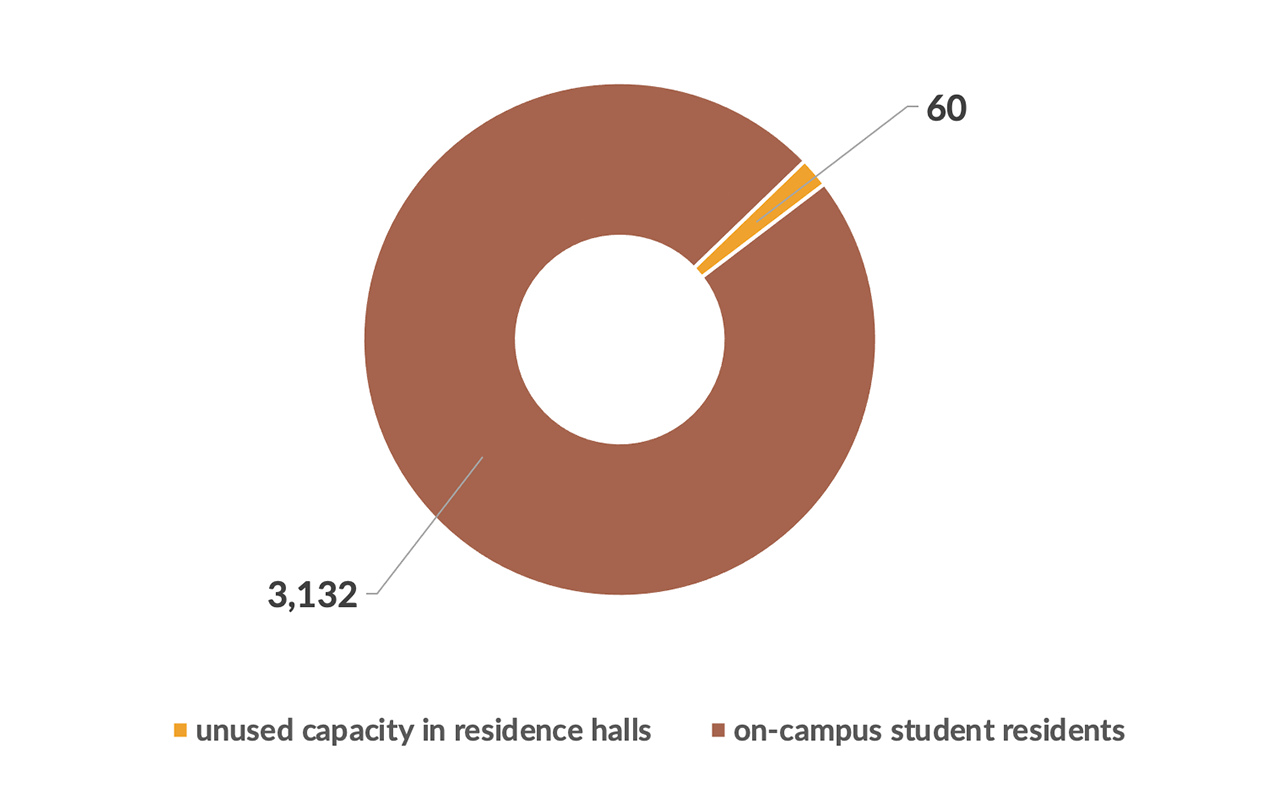
This pie chart illustrates the number of residents projected to be in on-campus student housing this fall (2921) and the number of unused beds (273), representing unused capacity.
Course Sections Offered
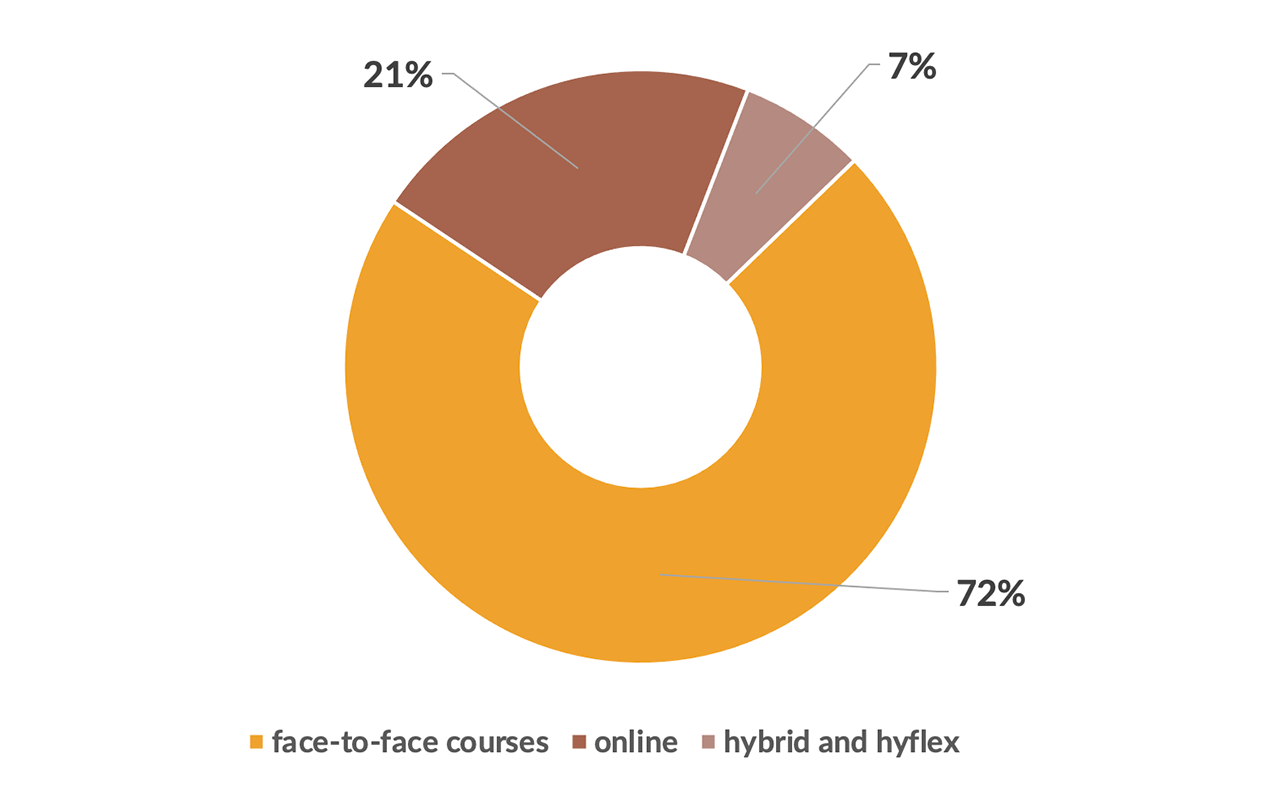
This pie chart illustrates the percentage of course sections this coming fall projected to have an in-person component (42%) and those that will be offered through remote instruction (58%).